Trace a Transaction
Begin with the Service Map. To open a service map, in the Sumo UI, click +New, and then Service Map.
Filter for Application Name= the-coffee-bar-app

In the Service map, you can see that the-coffee-bar-app shows anomalies in some of its micro services.
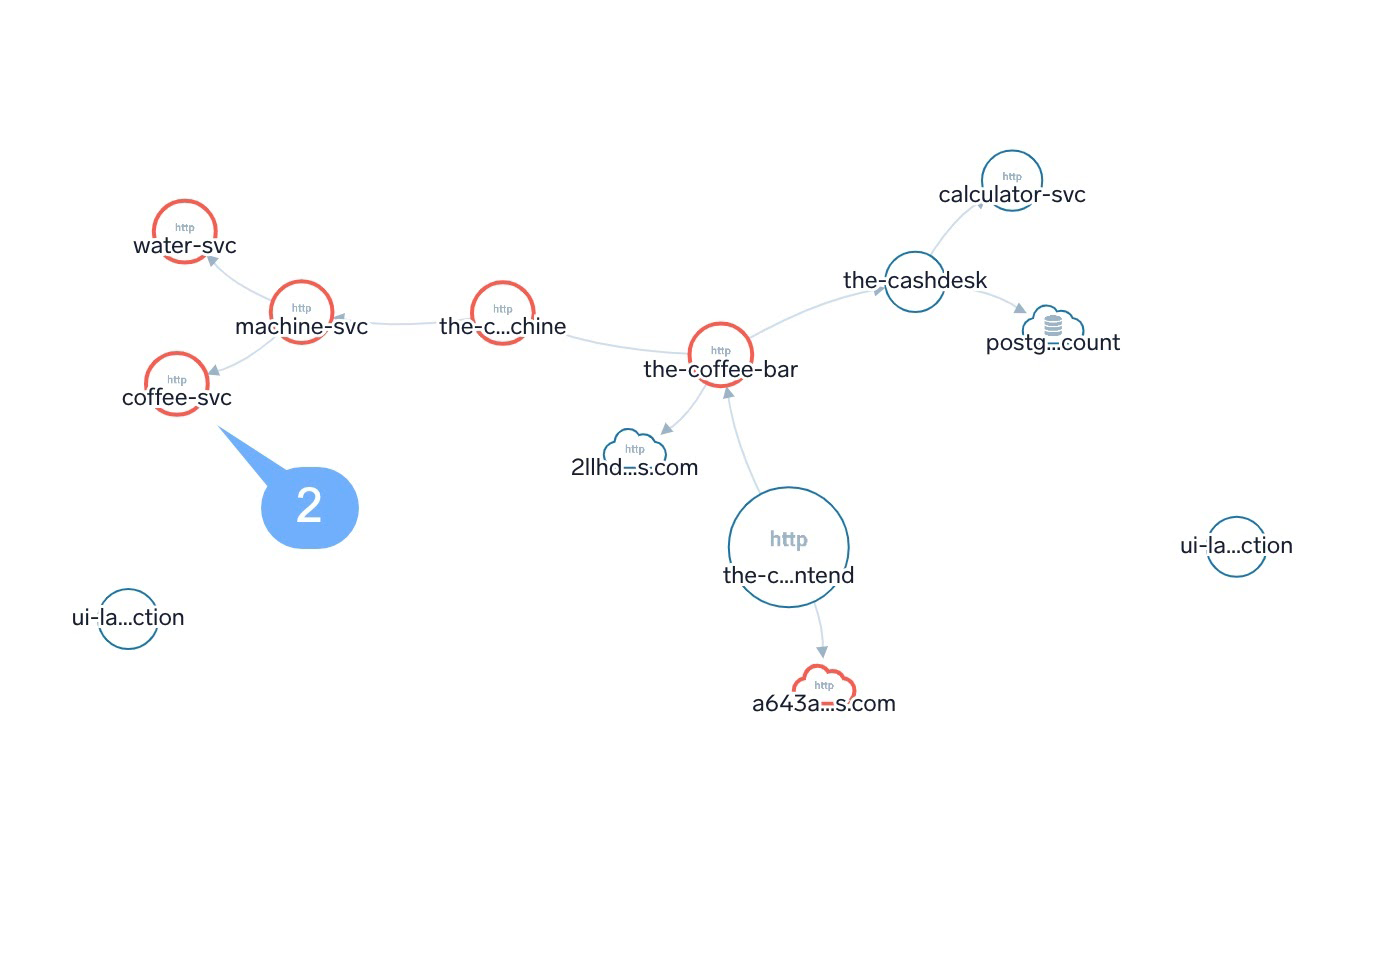
Mouse over one of the services that are showing anomalies, to see more details:
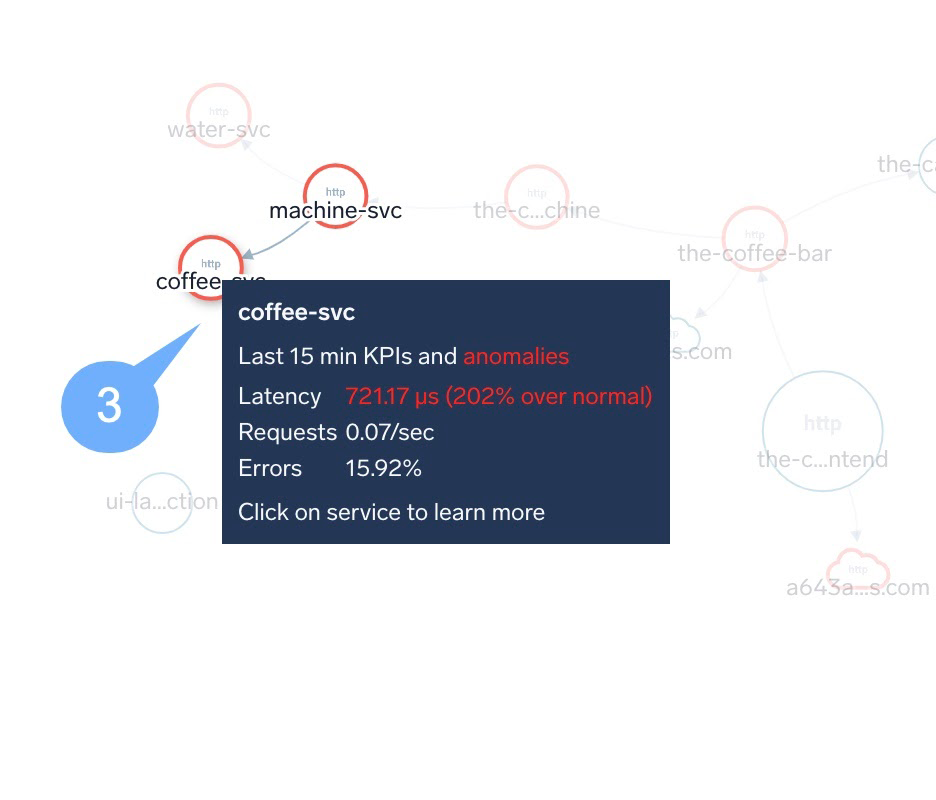
Click on the service with the anomaly, this will open the Entity Inspector, where the latency and error metrics are listed.
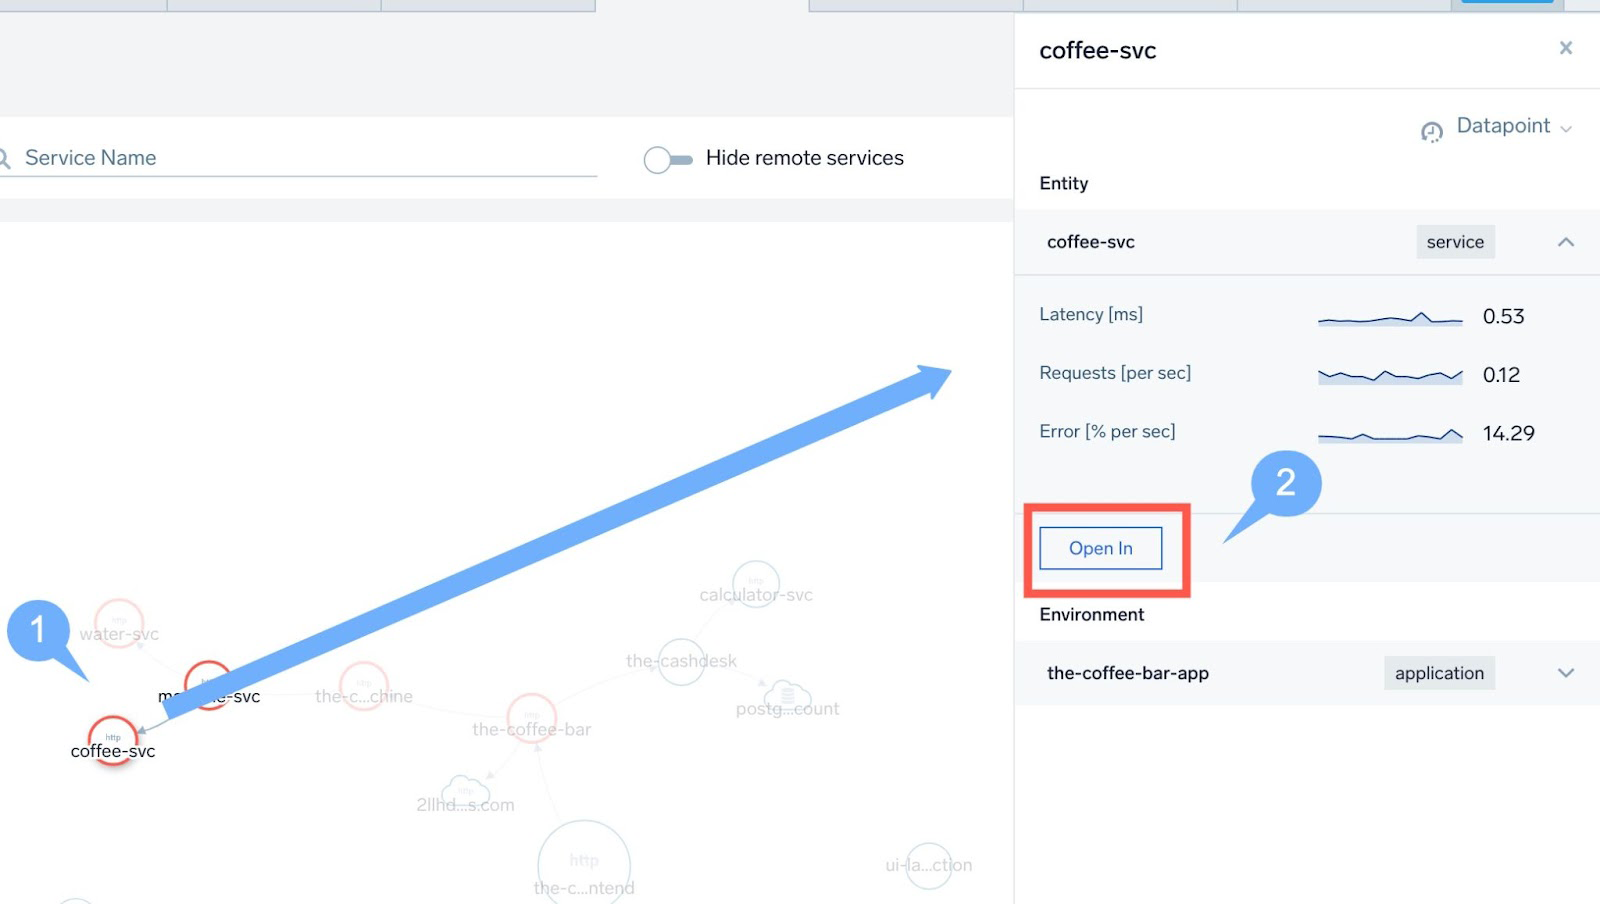
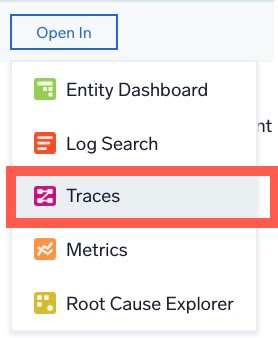
Click Open In, and then select Traces.
Alternatively, you can near the top of the Sumo Logic UI, click +New > Traces.
The trace page opens for the service selected. The window will show a list of traces related to that service, displayed in a table format.
Select the first trace on the table, alternatively you can filter the table by the number of error column
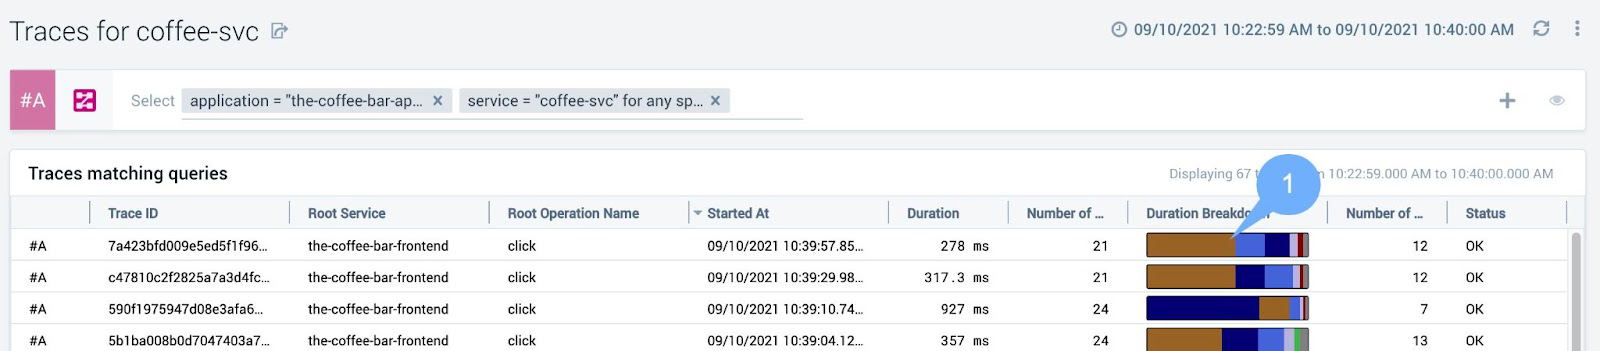
Click the trace Duration Breakdown to open the trace view.
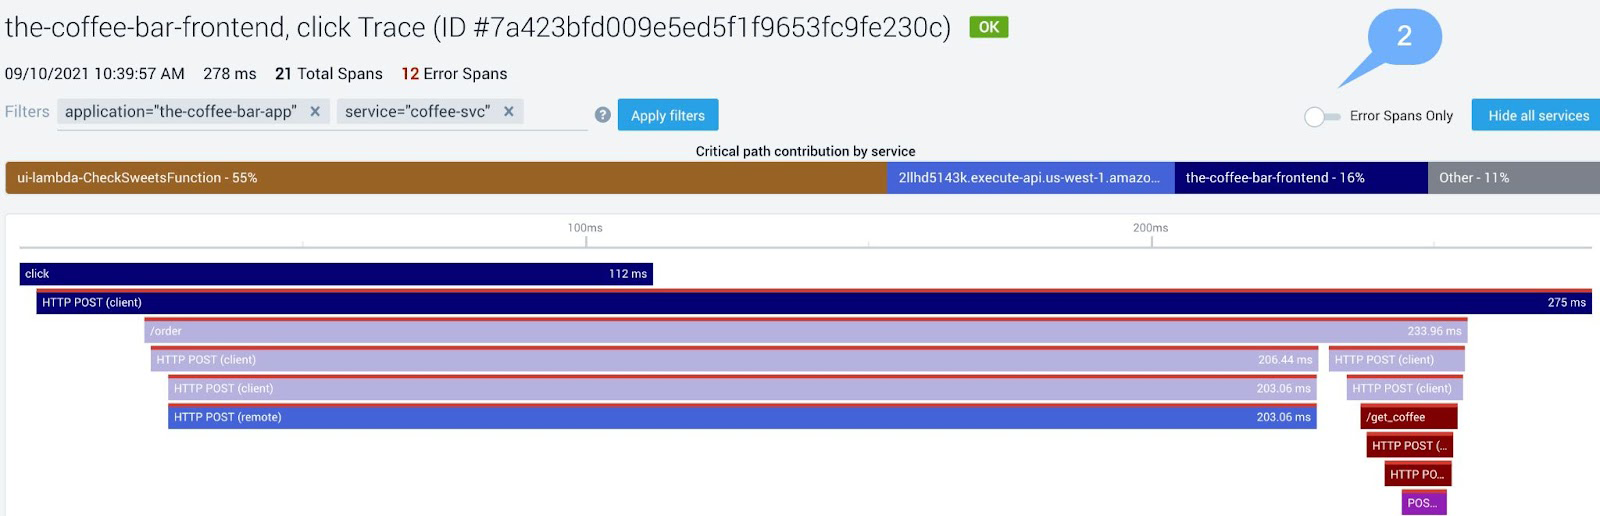
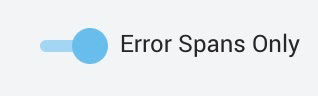
Filter by Error Span Only.
Click on the /get_coffee operation, to find out what happened to our coffee order.
If you have selected a different service the operation will also have a different name. For example, water service uses get_water.
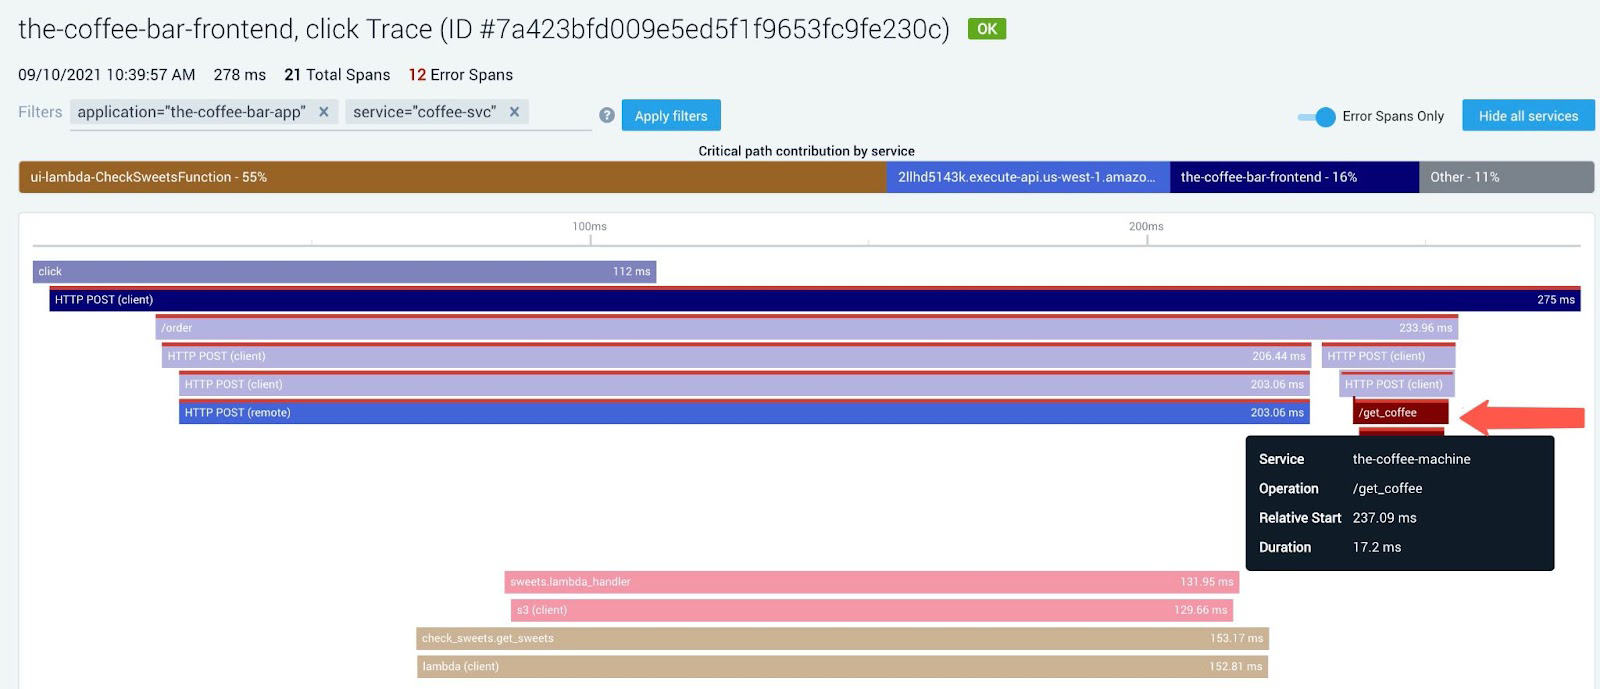
This will open the Detail Pane on the right of the screen, on the Summary Tab. You can see the span details of the transaction and related logs below the details.
Click the first Log search to open the logs related to the Span ID.
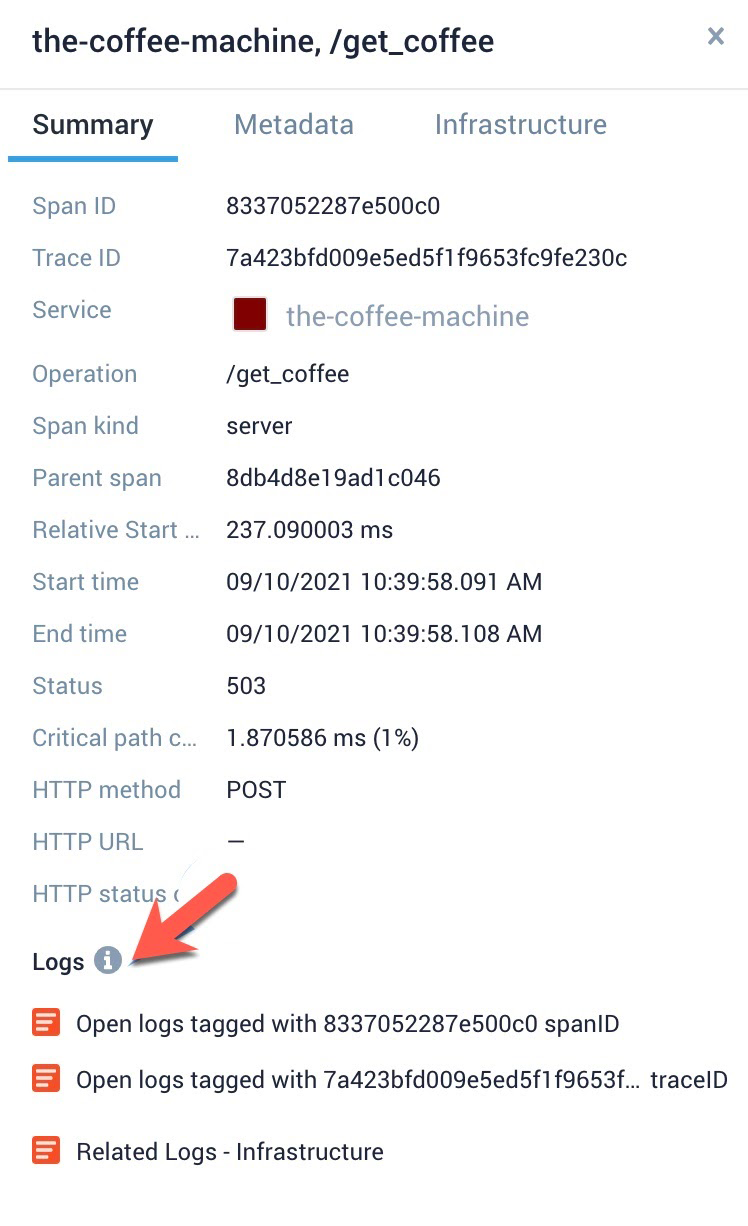
When you go through the logs entry, you will see the cause of the error.
If you have chosen another serve i.e the water service the error would have occurred due to insufficient water in the coffee machine.
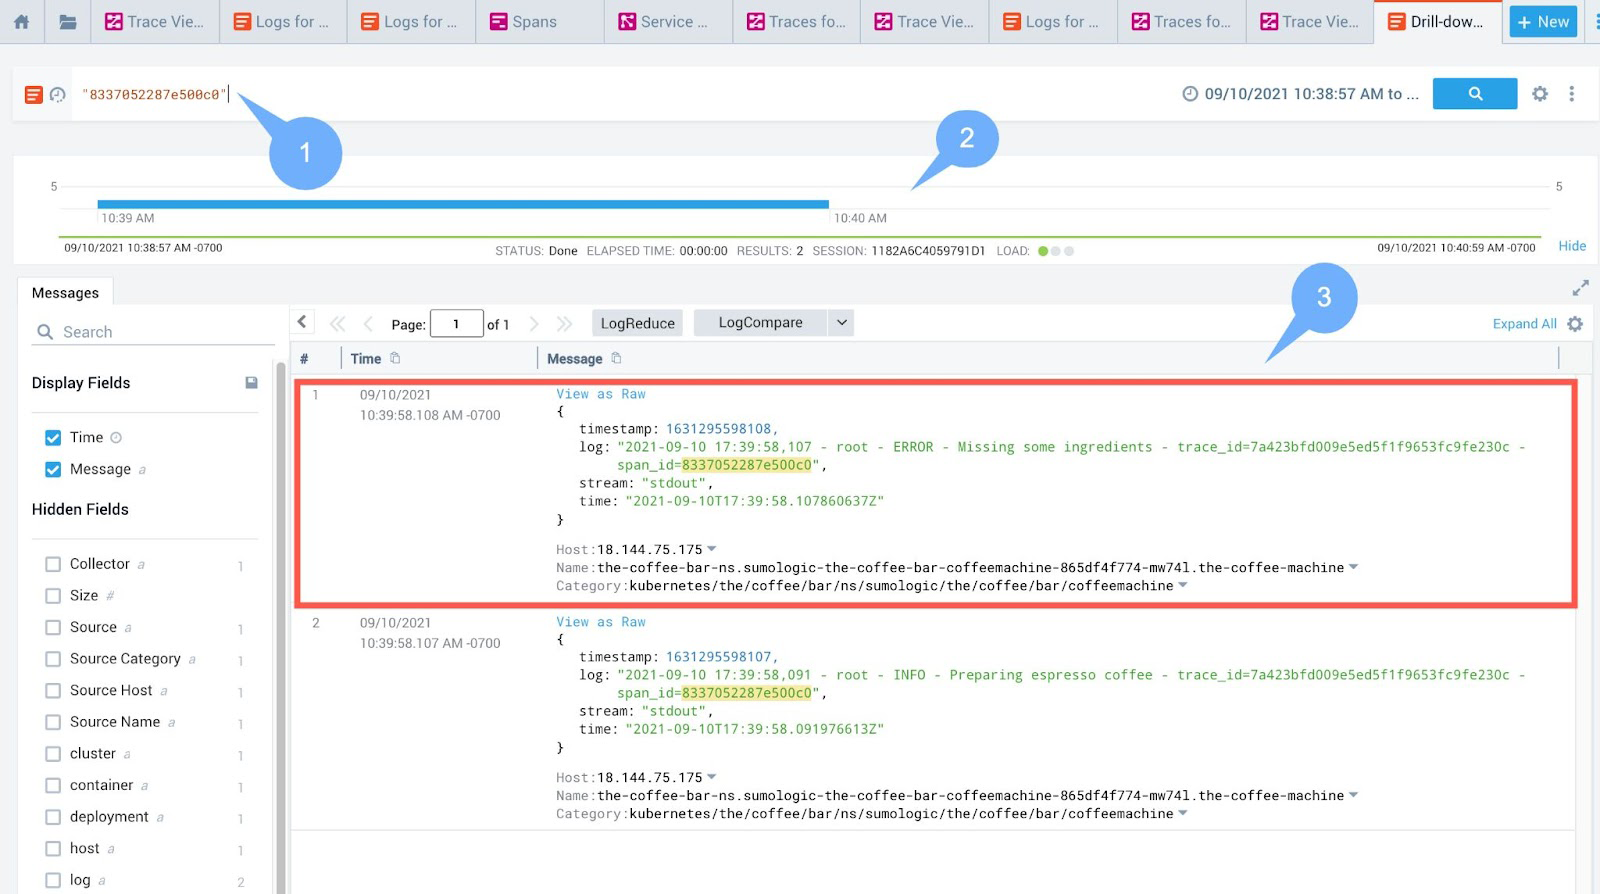
Inform the barista at the particular error so the problem can be rectified.
Optional: Use the SpanId and open in the Span Analytics tab to search and look further into the metadata related to the span.